
TrainingPeaks Explained
TrainingPeaks explained
TrainingPeaks has amazing metrics which can really help you keep track of progress and make sense of your workouts as you move through your training or general fitness routine.
Understanding some of the metrics it offers can help you make valuable decisions on how much stress you're creating, and how much rest you might need.
Understanding these things can help with optimising your time and workout strategy so you can be the best you in the time available in what can be a very hectic time crunched average week for a lot of people.
First off is understanding what the values within TP actually mean, TSS, IF, CTL, ATL, TSB. A little bit information overload until you see how simple those abbreviations can become.
Let me explain, for any given workout you will create values based on an algorithm built into TP software.
Coaches worldwide trust TP for the accuracy to ensure any athletes we coach are getting the best quantified measure for their hard work, so certainly what you see can be taken with a large degree of accuracy. (Apart from the human factor, which I'll explain later).
For example if you do a workout using a device which records data, HR, Power, GPS, and so on you will then be feeding information into TP which it uses to create your scores.
A 1 hour bike ride done at FTP, (functional threshold power) for the entirety will provide you with 100 TSS. Training stress score.
Think of this as a balance, think back to the old kitchen scales that balance out with equal weight either side. Your week starts with one side being at 500, if you keep both sides slightly above or below without the scales topping out then you're doing well.
Although there are times when that will go out of balance, injury or illness being one, and planned overload.
Over time you will have an average TSS per week, let's say its 500 TSS.
Each week your goal might be to keep those scales in balance by creating enough workload to keep hitting roughly 500 TSS per week. Perfect, consistency and general fitness remains at a very good level for those looking to maintain good health and balance.
The tricky part is knowing where that balance should be. If you're new to all of this, you might have a few weeks of data and feel great with a weekly total of 500 TSS, but over time by continuing to hit that balance you might either start feeling fatigued or feel like you're not getting any fitter. Progress has stopped.
The more data you accumulate over time the better your choices can be to stay in balance.
Now we can move to the other metrics,
CTL or fitness, (chronic training load).
CTL records a running tally of data over the past 42 days to create a number based on your daily average TSS.
CTL is a valuable metric for measuring progress, also as a means of looking at balance.
Due to most people having time restraints, once you progress upward with your CTL or fitness score, it can then become very difficult to keep driving that number upward. As an example someone who realistically has time to train 6-8 hours a week may struggle to go over 65 CTL, whereas a full time professional can sit in the 120 CTL region and still feel quite fresh. Remember longer duration will add more TSS points even when doing light exercise. A 5 hour bike ride done at 50% FTP is roughly 250 TSS , so a professional athlete will easily see weekly scores of 1200+ TSS. That weighted average will see them sit over 100 for CTL due to the time they have available to train.
What I like to do with CTL or fitness is compare year on year, or event to event.
If you look at your fitness score right now, is it higher or lower than this time last year? Or look at a previous event where you know you were at peak condition, we can then use that to aim for a similar scenario.
ATL or fatigue, Acute training load.
ATL is the fatigue built up based over the last seven days.
Again, you will notice patterns here. Usually weekends will drive this up as we generally workout longer creating more fatigue. This is fine as we do need some fatigue to make improvements, as long as we don't hold that fatigue up for long periods of time.
TSB Training stress balance or form
TSB is calculated by subtracting yesterdays fatigue from yesterday's fitness.
CTL Fitness - ATL Fatigue = TSB Form
TSB is very useful when tapering into an event. Generally a positive number represents you are rested and ready for your event. This can also mean you are over adapted or undertrained so this is an area to look for as well.
A neutral or near neutral TSB means you are adapted well to the current training.
A negative can mean you are not adapted to the load yet, or have been overloading your training. There are cases when this is a planned case when being coached.
My final one is IF, Intensity factor.
This is the percentage of your functional threshold power, or pace.
Let's say you do a workout and the average of that workout is done at 80% of Normalised power for cycling, Normalised graded pace for running NGP, or CSS critical swim speed for swimming. That gives you 0.80 IF. Time here isn't taken into the equation.
So if you do a 10 minute workout all at threshold then you will get 1.00 IF compared to doing a 5 hour workout which averages at threshold for the full duration, that will still be 1.00 IF.
So think of IF as how much oomph you've put into the session.
I did mention the human factor earlier.
This is where awareness and listening to your body comes in.
Numbers alone are one thing, but even with all the science and information available, it's still not an exact.
Feel is a great means of telling when to back off or when to up your game. If you feel tired for a string of days, then have that rest day even if the numbers don't show it.
The numbers use stress as a factor, well mental stress also accumulates, but this is not something any software can pull in for information.
Mental stress has the same effect as physical, so add a stressful week of work to a high TSS week and soon things can start feeling off.
Doing a self assessment is a good idea. As well as the data you accumulate in training per week, think about what else you've added to that.
Family, work, mood, yes even mood can all affect the balance. Make notes in your TP calendar, if you've had a stressful day, put it in. These are things you can look back on to build the picture as to why you may be tired or flip that around, feeling amazing.
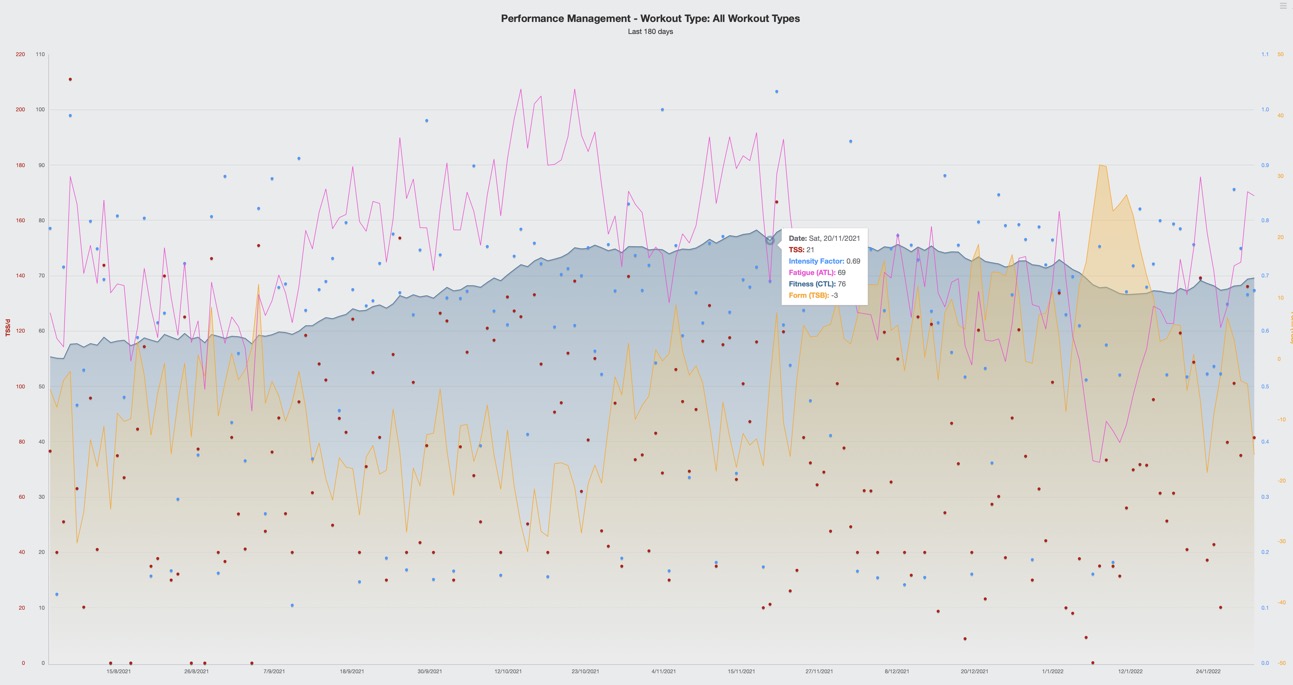
Example of Performance management chart leading to a peak event
Coaching
Cycling
Event
Insoles
Ironman
Ladies
Marathon
Racing
Recovery
Reviews
Running
Skills
Sport
Tips
Training
Triathlon